• Home
  • Managed Services
  • DevOps Enablement Solution
  • AI Enablement Solution
  • Blog
  • Privacy Policy
Cloudify Inc
No Result
View All Result
  • Login
  • Services
    • Intelligent Call Center Routing
    • Managed Services
    • Cloud Solutions For Small Business
    • DevOps Enablement Solution
    • AI Enablement Solution
  • DevOps Enablement
    DevOps Pipleline for Amazon ECS, EKS and Lambda using AWS CLI

    DevOps Pipleline for Amazon ECS, EKS and Lambda using AWS CLI

    Redshift vs. EKS Clusters: Key Differences Explained

    Redshift vs. EKS Clusters: Key Differences Explained

    Microservices with Kafka and EKS for Shipping Carriers

    Microservices with Kafka and EKS for Shipping Carriers

    DevOps Enablement Solution

    AWS DevOps Pipeline for Deploying Containers on an EKS Cluster

  • Cloud Solutions
    Create a Dynamic, Secure IVR using Amazon Connect

    Create a Dynamic, Secure IVR using Amazon Connect

    A Simple Chatbot with Amazon Lex

    A Simple Chatbot with Amazon Lex

    Implementing Call Routing Chatbots with Amazon Connect and Amazon Lex

  • Managed Services
    Create a Dynamic, Secure IVR using Amazon Connect

    Create a Dynamic, Secure IVR using Amazon Connect

    A Simple Chatbot with Amazon Lex

    A Simple Chatbot with Amazon Lex

    Implementing Call Routing Chatbots with Amazon Connect and Amazon Lex

  • eCommerce
    GenAI Ollama with ELLM to Chat with Confidential Documents Internally

    GenAI Ollama with ELLM to Chat with Confidential Documents Internally

    Power BI for Amazon and Walmart Marketplace Seller Reporting

    Power BI for Amazon and Walmart Marketplace Seller Reporting

    WooCommerce Site for Small Business

    WooCommerce Site for Small Business

    eCommerce Site on Shopify with Social Media Integration

    eCommerce Site on Shopify with Social Media Integration

    Create a Dynamic, Secure IVR using Amazon Connect

    Create a Dynamic, Secure IVR using Amazon Connect

  • Intelligent Reporting
    GenAI Ollama with ELLM to Chat with Confidential Documents Internally

    GenAI Ollama with ELLM to Chat with Confidential Documents Internally

    JSON Data Analysis using SageMaker

    JSON Data Analysis using SageMaker

    Python and AWS Sage Maker for Predictive Analysis

    Python and AWS Sage Maker for Predictive Analysis

    Simple Data Analysis with Python

    Exploring Key AI Concepts and Technologies

    Exploring Key AI Concepts and Technologies

    A Simple Chatbot with Amazon Lex

    A Simple Chatbot with Amazon Lex

19 °c
Chicago
Sat
Sun
Saturday, June 7, 2025
  • Services
    • Intelligent Call Center Routing
    • Managed Services
    • Cloud Solutions For Small Business
    • DevOps Enablement Solution
    • AI Enablement Solution
  • DevOps Enablement
    DevOps Pipleline for Amazon ECS, EKS and Lambda using AWS CLI

    DevOps Pipleline for Amazon ECS, EKS and Lambda using AWS CLI

    Redshift vs. EKS Clusters: Key Differences Explained

    Redshift vs. EKS Clusters: Key Differences Explained

    Microservices with Kafka and EKS for Shipping Carriers

    Microservices with Kafka and EKS for Shipping Carriers

    DevOps Enablement Solution

    AWS DevOps Pipeline for Deploying Containers on an EKS Cluster

  • Cloud Solutions
    Create a Dynamic, Secure IVR using Amazon Connect

    Create a Dynamic, Secure IVR using Amazon Connect

    A Simple Chatbot with Amazon Lex

    A Simple Chatbot with Amazon Lex

    Implementing Call Routing Chatbots with Amazon Connect and Amazon Lex

  • Managed Services
    Create a Dynamic, Secure IVR using Amazon Connect

    Create a Dynamic, Secure IVR using Amazon Connect

    A Simple Chatbot with Amazon Lex

    A Simple Chatbot with Amazon Lex

    Implementing Call Routing Chatbots with Amazon Connect and Amazon Lex

  • eCommerce
    GenAI Ollama with ELLM to Chat with Confidential Documents Internally

    GenAI Ollama with ELLM to Chat with Confidential Documents Internally

    Power BI for Amazon and Walmart Marketplace Seller Reporting

    Power BI for Amazon and Walmart Marketplace Seller Reporting

    WooCommerce Site for Small Business

    WooCommerce Site for Small Business

    eCommerce Site on Shopify with Social Media Integration

    eCommerce Site on Shopify with Social Media Integration

    Create a Dynamic, Secure IVR using Amazon Connect

    Create a Dynamic, Secure IVR using Amazon Connect

  • Intelligent Reporting
    GenAI Ollama with ELLM to Chat with Confidential Documents Internally

    GenAI Ollama with ELLM to Chat with Confidential Documents Internally

    JSON Data Analysis using SageMaker

    JSON Data Analysis using SageMaker

    Python and AWS Sage Maker for Predictive Analysis

    Python and AWS Sage Maker for Predictive Analysis

    Simple Data Analysis with Python

    Exploring Key AI Concepts and Technologies

    Exploring Key AI Concepts and Technologies

    A Simple Chatbot with Amazon Lex

    A Simple Chatbot with Amazon Lex

No Result
View All Result
Cloudify Inc
No Result
View All Result

Simple Data Analysis with Python

Home Data Analysis
Share on FacebookShare on Twitter

Data Analysis for Sales and Revenue: Unlocking Insights with Python

Introduction

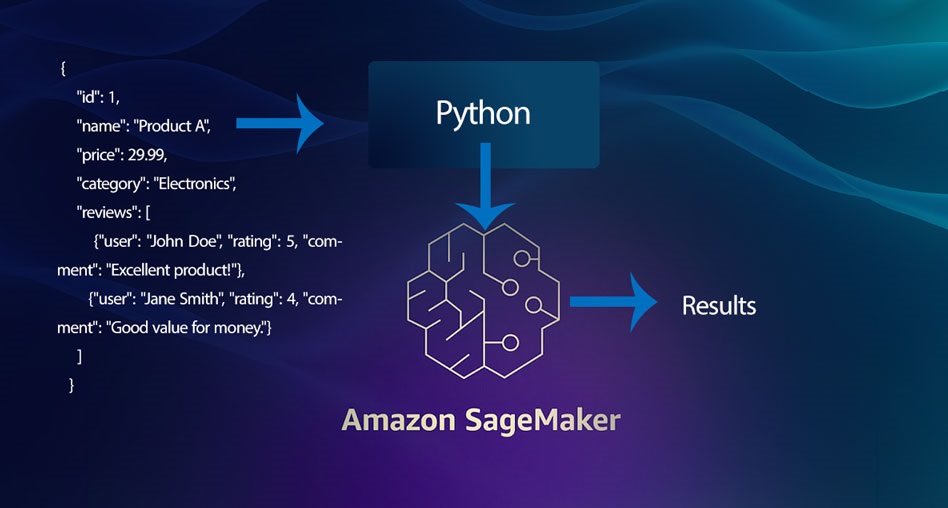
In the competitive world of business, understanding sales and revenue trends is crucial for making informed decisions. Data analysis provides valuable insights that can help businesses optimize their strategies, increase profits, and improve customer satisfaction. In this article, we will explore how to perform a data analysis for sales and revenue using Python, leveraging a hypothetical dataset.

Hypothetical Dataset

Let’s assume we have a dataset named sales_data.csv with the following columns:

  • Date: The date of the transaction.
  • Product_ID: The unique identifier for each product.
  • Product_Category: The category to which the product belongs.
  • Units_Sold: The number of units sold for each transaction.
  • Unit_Price: The price per unit of the product.
  • Revenue: The total revenue generated from the transaction (Units_Sold * Unit_Price).
  • Cost: The total cost of the products sold.
  • Profit: The profit generated from the transaction (Revenue – Cost).

Here’s an example of what the data might look like:

DateProduct_IDProduct_CategoryUnits_SoldUnit_PriceRevenueCostProfit
2024-01-011001Electronics10100.001000.00700.00300.00
2024-01-021002Apparel2050.001000.00600.00400.00
2024-01-031003Electronics5200.001000.00800.00200.00

Analyzing the Data with Python

Let’s dive into the analysis using Python. We will cover some basic analysis like total sales, revenue, profit trends, and category-wise performance.

Step 1: Importing the Required Libraries
import pandas as pd
import matplotlib.pyplot as plt

# Loading the dataset
data = pd.read_csv('sales_data.csv')
Step 2: Exploring the Data

Before we perform any analysis, it’s important to understand the structure of our dataset.

# Display the first few rows of the dataset
print(data.head())

# Check for missing values
print(data.isnull().sum())
Step 3: Total Sales and Revenue Over Time

We can analyze how sales and revenue have changed over time.

# Convert 'Date' to datetime format
data['Date'] = pd.to_datetime(data['Date'])

# Group by date to get daily totals
daily_sales = data.groupby('Date').agg({'Units_Sold': 'sum', 'Revenue': 'sum', 'Profit': 'sum'}).reset_index()

# Plotting sales and revenue over time
plt.figure(figsize=(14, 7))
plt.plot(daily_sales['Date'], daily_sales['Units_Sold'], label='Units Sold')
plt.plot(daily_sales['Date'], daily_sales['Revenue'], label='Revenue')
plt.plot(daily_sales['Date'], daily_sales['Profit'], label='Profit')
plt.title('Daily Sales, Revenue, and Profit Over Time')
plt.xlabel('Date')
plt.ylabel('Amount')
plt.legend()
plt.show()
Step 4: Analyzing Product Category Performance

We can analyze which product categories are performing well in terms of sales and profitability.

# Group by Product_Category to get category-wise totals
category_performance = data.groupby('Product_Category').agg({
    'Units_Sold': 'sum', 
    'Revenue': 'sum', 
    'Profit': 'sum'
}).reset_index()

# Plotting category-wise performance
plt.figure(figsize=(10, 5))
plt.bar(category_performance['Product_Category'], category_performance['Revenue'], label='Revenue')
plt.bar(category_performance['Product_Category'], category_performance['Profit'], label='Profit', alpha=0.7)
plt.title('Revenue and Profit by Product Category')
plt.xlabel('Product Category')
plt.ylabel('Amount')
plt.legend()
plt.show()

# Displaying the category performance
print(category_performance)
Step 5: Profit Margin Analysis

Let’s calculate and analyze the profit margin for each product category.

# Calculate profit margin
data['Profit_Margin'] = (data['Profit'] / data['Revenue']) * 100

# Group by Product_Category to get average profit margin
category_margin = data.groupby('Product_Category')['Profit_Margin'].mean().reset_index()

# Displaying the profit margins
print(category_margin)

Conclusion

Through this analysis, we’ve explored how sales, revenue, and profit can be analyzed using Python. By understanding trends over time, identifying top-performing product categories, and analyzing profit margins, businesses can make data-driven decisions to optimize their operations.

This is just the beginning—advanced analyses can include customer segmentation, predictive analytics, and more. With Python, the possibilities are endless.

This article provides a foundational approach to sales and revenue analysis using Python. By leveraging similar techniques on real-world datasets, businesses can gain valuable insights to drive growth and profitability

Irfan Ahmad

Irfan Ahmad

MS Computer Science | MS Statistics| Certified AWS Solution Architect Associate| Certified AWS DevOps Professional Software Architect |Java Cloud Engineer | Senior Java Developer | Microservices |AWS

Next Post
Python and AWS Sage Maker for Predictive Analysis

Python and AWS Sage Maker for Predictive Analysis

Recommended.

Create a Dynamic, Secure IVR using Amazon Connect

Create a Dynamic, Secure IVR using Amazon Connect

A Simple Chatbot with Amazon Lex

A Simple Chatbot with Amazon Lex

Trending.

Exploring Key AI Concepts and Technologies

Exploring Key AI Concepts and Technologies

Implementing Call Routing Chatbots with Amazon Connect and Amazon Lex

eCommerce Site on Shopify with Social Media Integration

eCommerce Site on Shopify with Social Media Integration

WooCommerce Site for Small Business

WooCommerce Site for Small Business

DevOps Enablement Solution

AWS DevOps Pipeline for Deploying Containers on an EKS Cluster

Subscribe.

  • Home
  • Managed Services
  • DevOps Enablement Solution
  • AI Enablement Solution
  • Blog
  • Privacy Policy
Call us: +1 800 507 0225

© 2024 Copyrights reserved by Cloudify Inc

Welcome Back!

Login to your account below

Forgotten Password?

Retrieve your password

Please enter your username or email address to reset your password.

Log In
No Result
View All Result
  • Home
  • Small Business Technology Solutions
  • DevOps Enablement Solution
  • Managed Services
  • Intelligent Call Center Routing
  • AI Enablement Solution

© 2024 Copyrights reserved by Cloudify Inc

This website uses cookies. By continuing to use this website you are giving consent to cookies being used. Visit our Privacy and Cookie Policy.