As an online retailer on Amazon and Walmart, managing and analyzing your marketplace data effectively is crucial for driving growth and profitability. With multiple streams of data from these platforms, extracting meaningful insights can be challenging. Power BI, Microsoft’s powerful business intelligence tool, offers a solution by enabling sellers to transform raw data into actionable insights. In this article, we’ll explore how Amazon and Walmart marketplace sellers can utilize Power BI for comprehensive business reporting.
Why Power BI for Marketplace Sellers?
- Centralized Data Management:
Power BI allows sellers to consolidate data from multiple sources, including Amazon Seller Central, Walmart Seller Center, and other third-party tools. By centralizing your data, you can avoid the hassle of logging into different platforms to get the information you need. - Real-Time Data Insights:
The eCommerce environment is fast-paced, with sales, inventory, and customer behavior changing rapidly. Power BI’s ability to connect with APIs and real-time databases ensures that your reports are always up-to-date, enabling timely decision-making. - Customizable Dashboards:
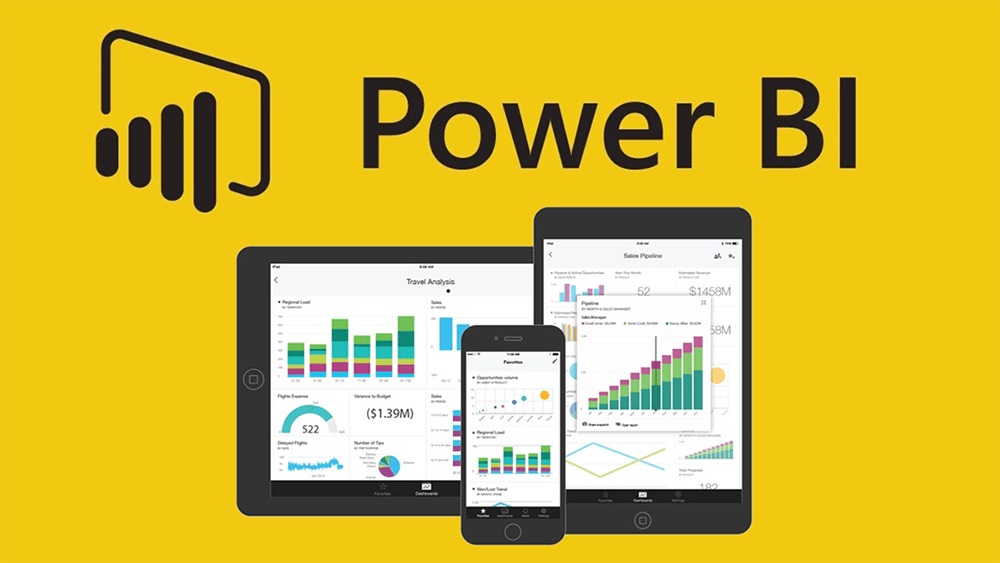
Power BI offers customizable dashboards that can be tailored to the specific needs of your business. Whether you need to monitor sales performance, track inventory levels, or analyze customer reviews, you can design dashboards that display the most relevant KPIs at a glance. - Automated Reporting:
Automating reports in Power BI saves time and reduces the risk of human error. Sellers can schedule reports to be generated and emailed automatically, ensuring stakeholders always have the latest information without manual intervention.

Key Reports for Amazon and Walmart Sellers
- Sales Performance Report:
This report provides an overview of your sales metrics, including total revenue, units sold, average order value, and sales trends over time. By breaking down sales by product category, region, or sales channel, you can identify top-performing products and areas for improvement. - Inventory Management Report:
Power BI can help you monitor your inventory levels across different warehouses and fulfillment centers. The inventory management report can alert you to low stock levels, helping you avoid stockouts, and overstock situations, which can tie up capital. - Profitability Analysis:
Profit margins can vary significantly across different products and platforms. A profitability analysis report can break down costs such as Amazon and Walmart fees, shipping costs, and cost of goods sold (COGS), giving you a clear picture of your net profit per product. - Customer Review and Feedback Analysis:
Analyzing customer reviews and feedback can provide valuable insights into product quality and customer satisfaction. Power BI can aggregate review data from Amazon and Walmart, allowing you to track review trends and identify common issues that may need to be addressed. - Advertising Performance Report:
If you’re running advertising campaigns on Amazon or Walmart, tracking their performance is crucial. This report can provide insights into your ad spend, cost-per-click (CPC), return on ad spend (ROAS), and the overall effectiveness of your campaigns.
Getting Started with Power BI for Marketplace Reporting
- Data Integration:
Start by integrating your Amazon and Walmart data into Power BI. This can be done using pre-built connectors or APIs that allow you to pull data directly from these platforms. You may also need to use third-party tools or custom scripts to extract and transform the data into a format suitable for Power BI. - Designing Your Dashboards:
Once your data is in Power BI, begin designing your dashboards. Focus on the KPIs that matter most to your business, and arrange them in a way that makes the information easy to digest. Utilize Power BI’s visualization tools to create charts, graphs, and tables that highlight key trends and insights. - Automating Reports:
Set up automated reporting schedules within Power BI to ensure that your reports are generated and distributed regularly. This could be daily, weekly, or monthly, depending on your business needs. Automation reduces the manual workload and ensures consistency in reporting. - Continuous Improvement:
The eCommerce landscape is always evolving, and so should your reports. Regularly review your Power BI dashboards and reports to ensure they align with your current business goals. Make adjustments as needed to keep your reporting relevant and actionable.
Conclusion
Power BI is a game-changer for Amazon and Walmart marketplace sellers looking to take their business reporting to the next level. By leveraging its powerful data integration, visualization, and automation features, sellers can gain deeper insights into their operations, make data-driven decisions, and ultimately drive greater profitability. Whether you’re a seasoned seller or just starting out, integrating Power BI into your reporting toolkit can provide a competitive edge in the rapidly evolving eCommerce space.


